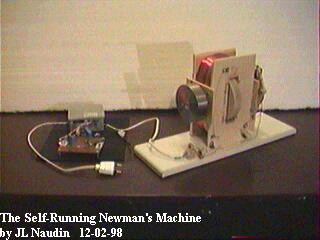

The Newman's Energy Machine
Power Flow measurements
created on 12-14-98 - JLN Labs - last update on 12-14-98
12-14-98 - New Power measurements: now, the self-running effect explained ?
In this test, I
have conducted different measurements about my Newman's Machine
v2.1. This is an enhanced version of the V2.0
All the measurement has been done with the Tektronix THS720P as a
Digital MultiMeter in recorder mode and ALSO been checked with an
ANALOG METER (Voltmeter Metrix EM25-1030B ).
(see
the analog/digital measurements pictures)
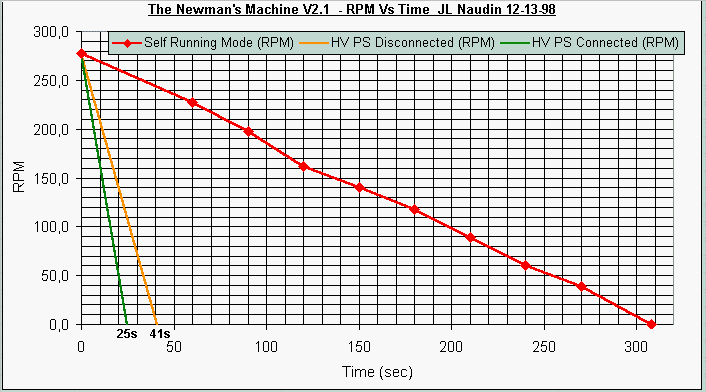
The diagram below
shows the rotation speed of the machine with respect to time in
three curves :
- the Green curve : The machine has been previously set at
the 280 RPM with the power supply connected but with its
capacitors discharged (power off state). After a free run, the
machine has stopped after 25
seconds.
- the Orange curve : The machine has been previously set at
the 280 RPM with the power supply completly disconnected from the
machine. After a free run, the machine has stopped after 41 seconds.
- the Red curve : The machine has been normaly connected
to power supply at the speed was 280 RPM and stable. After the
switch off and a free run, the machine has stopped after 308 seconds. At 280 RPM the average electrical power
required was 110mW.
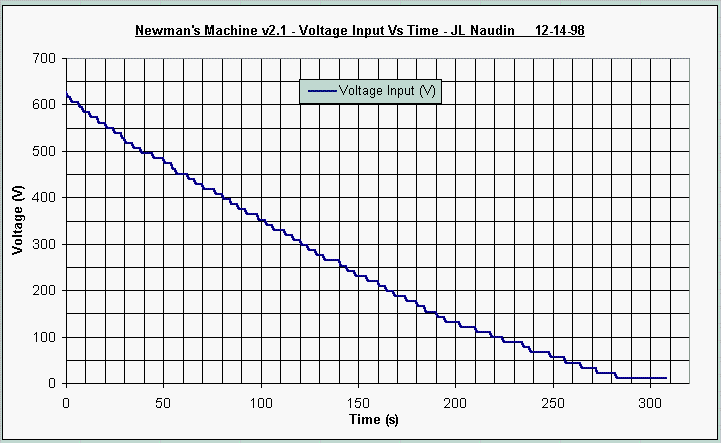
The diagram above shows the Voltage with respect to time at the Input of the Newman's Machine v2.1, the timer has been started when the power supply has been swiched off.
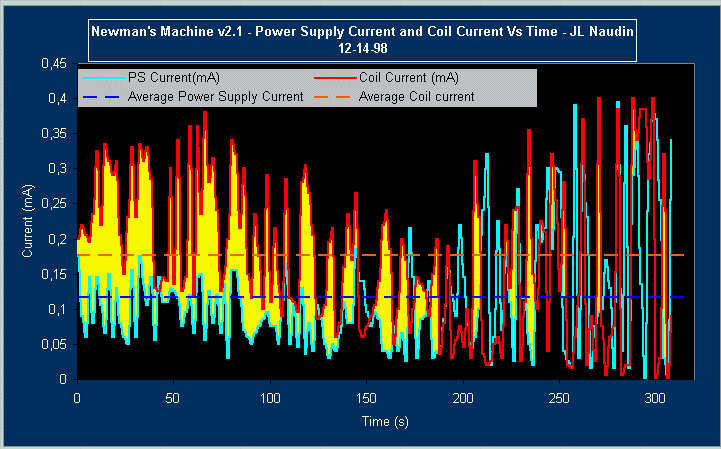
The diagram
above shows the Power Supply Current and the current in the
Newman's Coil with respect to time, the timer has been started
when the power supply has been swiched off.
You may notice
that, during about 180 seconds the coil
current (red curve) was always greater than the power supply
current ( blue curve) (this is the yellow
area) this mean that an additional current flow has been created
in the coil, thus this create additional magnetic power in the
coil (motive power).
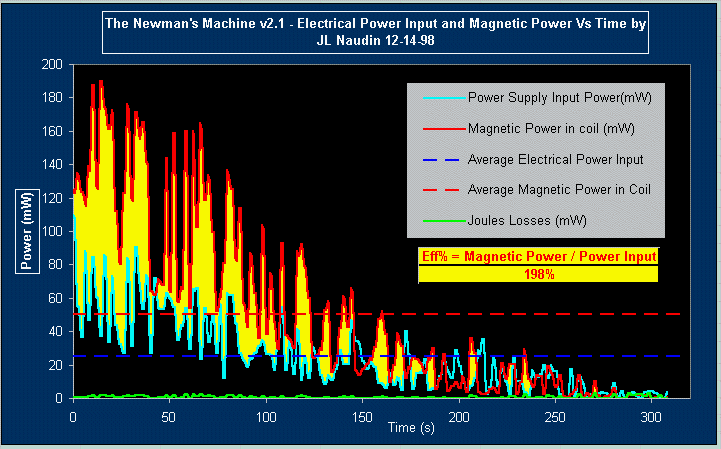
Now, see the diagram below, this represent the curves of the electrical power input (blue curve), the power losses by Joule effect in the coil (green curve) and the magnetic power in the coil with respect to time, the timer has been started when the power supply has been swiched off. The blue dotted line shows the average of the electrical power input and the red dotted line shows the average of the magnetic power in the coil. Now, the overunity effect during the first 180 seconds can be explained because the magnetic power was always greater than the electrical power input and this adds some extra torque in the rotating magnets. Unfortunately after these 180 seconds the magnetic power begin lower than the power input and this drops dramaticaly the efficiency and the machine stops after a run of 308 seconds.
See also : Demonstration of the Self-Running Newman's Machine (12-03-98)
If you need more informations or if you have any suggestions send me your Feedback
![]() Email
: [email protected]
Email
: [email protected]
Return to the Newman's Machine Main page